Flight Delay Data
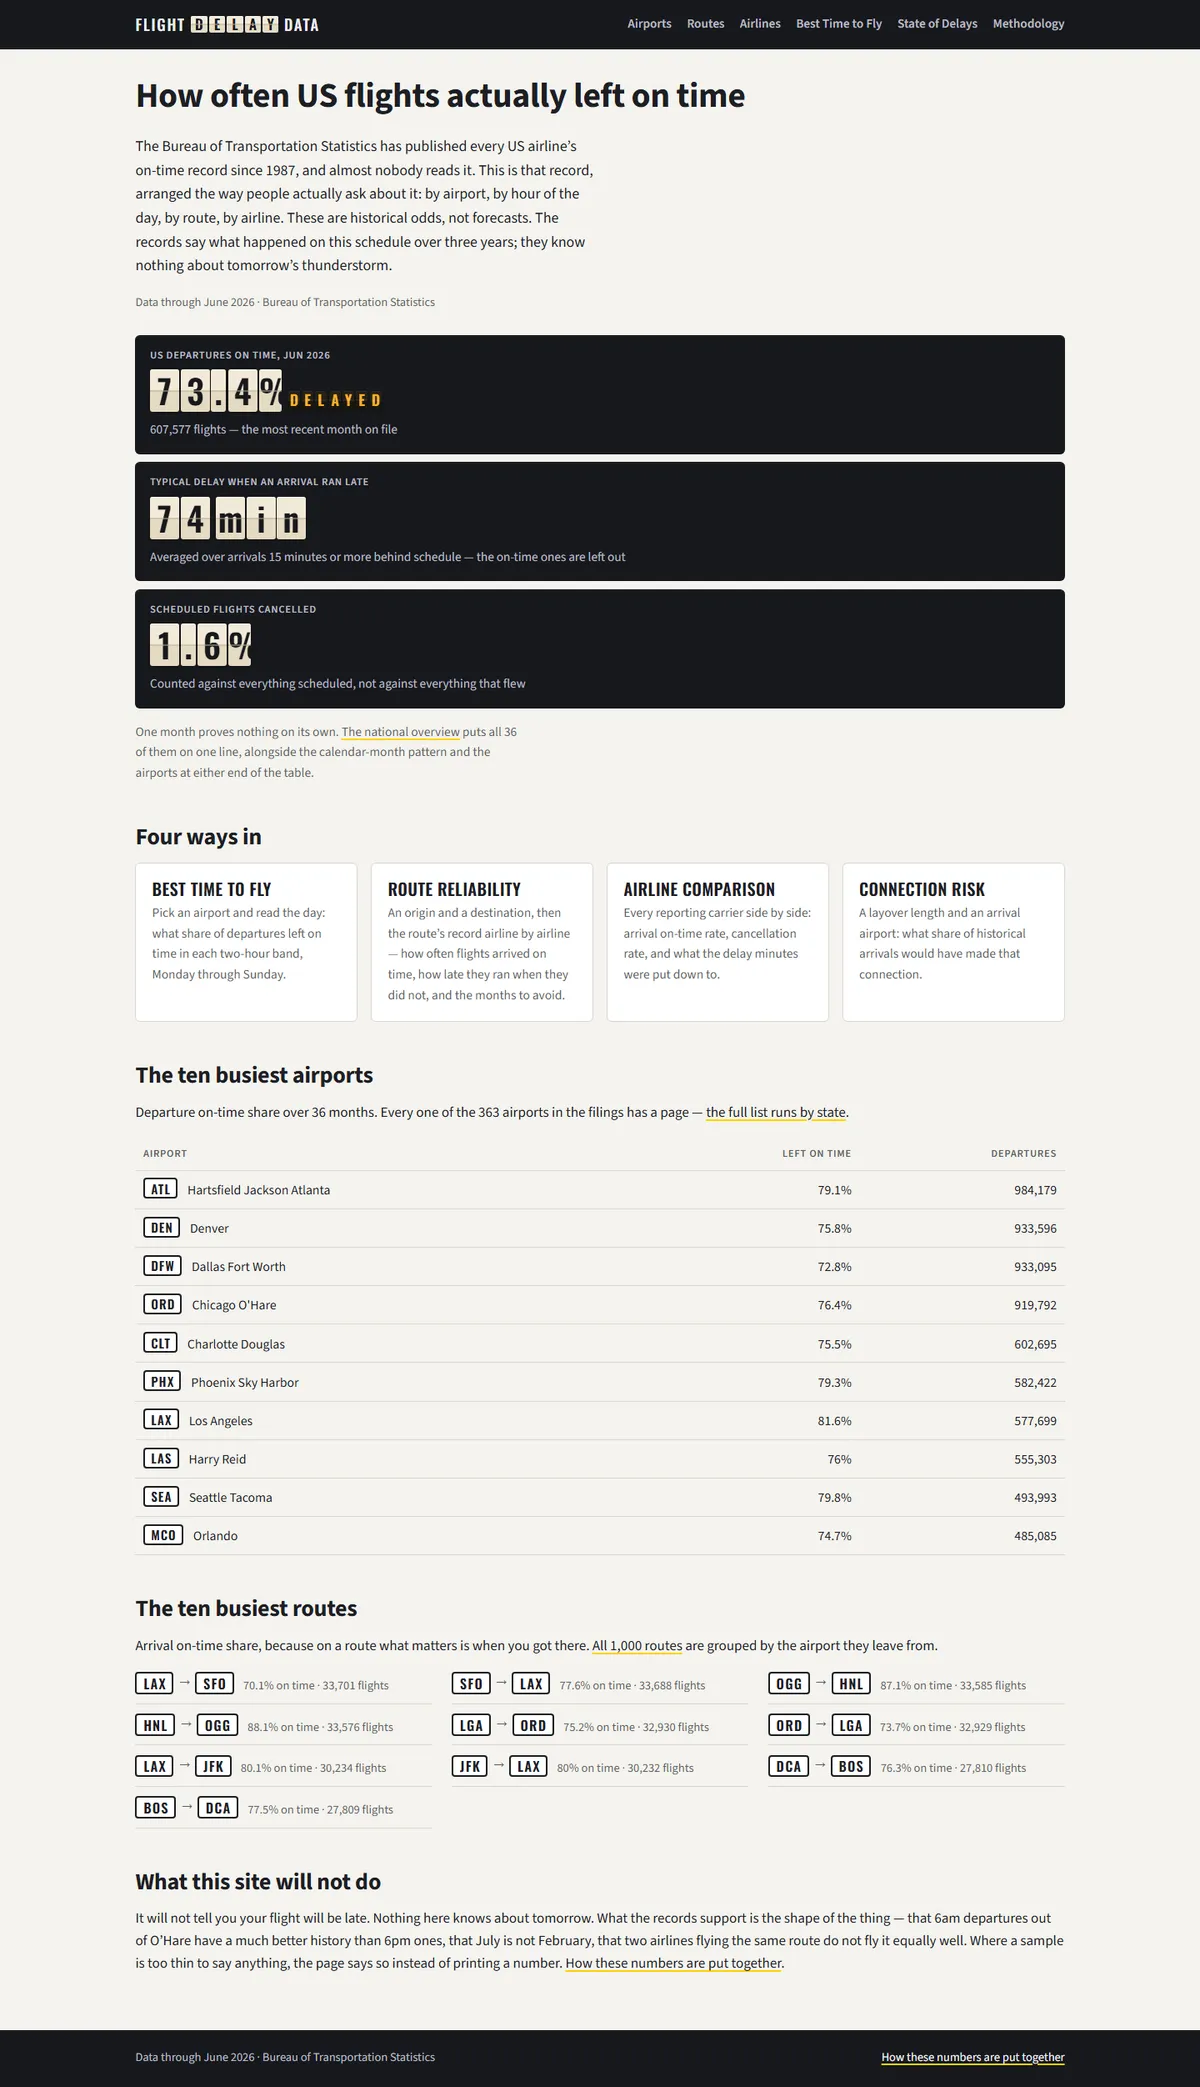
Flight Delay Data arranges the US Bureau of Transportation Statistics on-time filings by airport, route, airline and hour of the day, for anyone choosing between two flights. It refuses to forecast, and where a sample thins below 100 flights it prints a blank rather than a percentage.
Why it earned its spot
Three black panels carry the headline figures with their digits set on cream tiles — a split-flap departure board rebuilt in the browser, and the only flourish on a page otherwise made of warm off-white, a plain sans, and hairline rules. Everything below is tabular: ten airports with their IATA codes boxed like baggage tags, ten routes set as origin-arrow-destination pairs, each carrying its share and its flight count. Amber underlines are the only other colour. It closes on a section headed ‘What this site will not do’, which is where the restraint stops being a style and becomes the argument.
The colors
Belongs with
Get the badge for Flight Delay Data
Drop it anywhere on Flight Delay Data; it points straight back to this spot.

<a href="https://earnaspot.com/spot/flightdelaydata">
  <img src="https://earnaspot.com/badge.svg"
       alt="Earned a spot on Earnaspot" width="178" height="40">
</a>Other spots in Travel & hospitality

Skiplagged is a flight search engine that surfaces hidden-city fares — tickets that cost less if you get off at the layover and skip the final leg. Its homepage leads with the fact that United Airlines sued it and lost, which is not the usual opening line for a booking site.